
Curate your content on Posit Connect
connectwidgets is an R package that can be used to query
a Posit Connect server for a subset of your existing content items, then
organize them within htmlwidget components in an R Markdown
document or Shiny application.
Use connectwidgets to create a content hub or knowledge
repository, a customized summary page for a particular group of
stakeholders, or a presentation layer for any group of related
content.
You can install connectwidgets from CRAN using:
install.packages("connectwidgets")Alternatively, you can install the development version from GitHub:
# install.packages("remotes")
remotes::install_github("rstudio/connectwidgets")Use the template:
rmarkdown::draft("example-page.Rmd", template = "connectwidgets", package = "connectwidgets")You can also copy and knit the following example, or read on for more details:
---
title: an example page
output: html_document
---
```{r setup, include=FALSE}
library(connectwidgets)
library(dplyr)
knitr::opts_chunk$set(echo = FALSE, message = FALSE, warning = FALSE)
client <- connect(
# server = Sys.getenv("CONNECT_SERVER"),
# api_key = Sys.getenv("CONNECT_API_KEY")
)
all_content <- client %>%
content()
sample_content <- all_content %>%
arrange(desc(updated_time)) %>%
slice_head(n = 50)
```

## Components
### card
```{r card}
sample_content %>%
slice(1) %>%
rsc_card()
```
### grid
```{r grid}
sample_content %>%
rsc_grid()
```
### table
```{r table}
sample_content %>%
rsc_table()
```
### search & filter
```{r search-and-filter}
rsc_cols(rsc_search(all_content), rsc_filter(all_content), widths = c(2, 2))
rsc_table(all_content)
```The client object:
Use an .Renviron file to set the
CONNECT_SERVER and CONNECT_API_KEY environment
variables. If you’re not familiar with setting environment variables,
check out the R
Startup chapter of What They Forgot to Teach You About R. Posit
Connect will automatically
apply values for these at document run time, so there is no need to
include them in your code:
library(connectwidgets)
library(dplyr, warn.conflicts = FALSE)

knitr::opts_chunk$set(echo = FALSE, message = FALSE, warning = FALSE)

client <- connect(
  # server  = Sys.getenv("CONNECT_SERVER"),
  # api_key = Sys.getenv("CONNECT_API_KEY")
  )

all_content <- client %>%
  content()

glimpse(all_content)
#> Rows: 12
#> Columns: 15
#> $ id               <int> 12, 11, 10, 9, 8, 7, 6, 5, 4, 3, 2, 1
#> $ guid             <chr> "0b7e0b47-a8c7-4492-87ea-7082eb942839", "d0664722-a93…
#> $ name             <chr> "puser3-acl-static-plot-with-title-and-description", …
#> $ title            <chr> "Static Plot (Title and Description)", "Static Plot (…
#> $ description      <chr> "This static plot was deployed with a title and a des…
#> $ app_mode         <chr> "static", "static", "static", "static", "static", "st…
#> $ content_category <chr> "plot", "plot", "plot", "plot", "plot", "plot", "plot…
#> $ url              <chr> "http://localhost:3939/content/0b7e0b47-a8c7-4492-87e…
#> $ owner_guid       <chr> "504a8529-9a89-4062-8758-a419a490a9a3", "4dfa986f-3e4…
#> $ owner_username   <chr> "puser3", "puser2", "puser1", "puser3", "puser2", "pu…
#> $ owner_first_name <chr> "", "", "", "", "", "", "", "", "", "", "", ""
#> $ owner_last_name  <chr> "", "", "", "", "", "", "", "", "", "", "", ""
#> $ created_time     <dttm> 2023-01-10 22:37:59, 2023-01-10 22:37:59, 2023-01-10 …
#> $ updated_time     <dttm> 2023-01-10 22:37:59, 2023-01-10 22:37:59, 2023-01-10 …
#> $ tags             <list> <NULL>, <NULL>, <NULL>, <NULL>, <NULL>, <NULL>, <NULL…

sample_content <- all_content %>%
  arrange(desc(updated_time)) %>%
slice_head(n = 100)content()content() returns a data frame with the following
columns:
id - Auto-incrementing identifier for each content item
(legacy)guid - Unique identifier for each content item
(preferred)app_mode - The type of the content item (examples:
shiny, rmd-static, static,
python-dash, etc.)content_category - For static app modes,
the specific category of content (examples: site,
plot, pin, etc.)name - The name of the content item as set at initial
publishingtitle - The user-provided title of the content
itemdescription - The user-provided description of the
content itemurl - The URL to the content itemowner_guid - Unique identifier of the owner of the
content itemowner_username - Username of the owner of the content
itemowner_first_name - First name of the owner of the
content itemowner_last_name - Last name of the owner of the content
itemtags - A data frame of the tags associated with the
content item, with the following columns: id,
name, parent_id, created_time,
updated_time.created_time - The timestamp at which the content item
was createdupdated_time - The timestamp at which the content item
was last updatedThe data frame contains one row for each item visible to the requesting user. For users in an “administrator” role, that will be all content items.
We provide helper functions to filter by both owners and tags.
by_tags() - Filters the data frame to only include
content that has been tagged with the specified tag name(s). You can
pass a single tag name or a vector of tag names. by_tag is
provided as an alias for readability when using a single tag.
by_owners() - Filters the data frame to only include
content with the specified owner(s) by username. You can pass a single
username or a vector of usernames. by_owner is provided as
an alias for readability when using a single username.
all_content %>%
  by_tag("Audit Reports")
#> # A tibble: 0 × 15
#> # … with 15 variables: id <int>, guid <chr>, name <chr>, title <chr>,
#> #   description <chr>, app_mode <chr>, content_category <chr>, url <chr>,
#> #   owner_guid <chr>, owner_username <chr>, owner_first_name <chr>,
#> #   owner_last_name <chr>, created_time <dttm>, updated_time <dttm>,
#> #   tags <list>
Since all_content is a tibble(), you can
also manipulate it with dplyr:
all_content %>%
filter(updated_time >= "2021-01-01") %>%
arrange(created_time)
#> # A tibble: 12 × 15
#> id guid name title descr…¹ app_m…² conte…³ url owner…⁴ owner…⁵ owner…⁶
#> <int> <chr> <chr> <chr> <chr> <chr> <chr> <chr> <chr> <chr> <chr>
#> 1 6 18b2… puse… Stat… "" static plot http… 504a85… puser3 ""
#> 2 5 2460… puse… Stat… "" static plot http… 4dfa98… puser2 ""
#> 3 4 3de7… puse… Stat… "" static plot http… f6fd68… puser1 ""
#> 4 3 7299… puse… <NA> "" static plot http… 504a85… puser3 ""
#> 5 2 edab… puse… <NA> "" static plot http… 4dfa98… puser2 ""
#> 6 1 7ccf… puse… <NA> "" static plot http… f6fd68… puser1 ""
#> 7 12 0b7e… puse… Stat… "This … static plot http… 504a85… puser3 ""
#> 8 11 d066… puse… Stat… "This … static plot http… 4dfa98… puser2 ""
#> 9 10 c335… puse… Stat… "This … static plot http… f6fd68… puser1 ""
#> 10 9 66f2… puse… <NA> "This … static plot http… 504a85… puser3 ""
#> 11 8 e7dd… puse… <NA> "This … static plot http… 4dfa98… puser2 ""
#> 12 7 5d4e… puse… <NA> "This … static plot http… f6fd68… puser1 ""
#> # … with 4 more variables: owner_last_name <chr>, created_time <dttm>,
#> # updated_time <dttm>, tags <list>, and abbreviated variable names
#> # ¹description, ²app_mode, ³content_category, ⁴owner_guid, ⁵owner_username,
#> # ⁶owner_first_nameOnce your content data are filtered, connectwidgets
provides components for displaying information about them. The title,
description, and preview image can be set from
the Posit Connect dashboard. For content deployed to Connect where
no image has been supplied, a default image will be used.
Note: In many cases, you will only see default images until your content is deployed.
Use a card to highlight an individual piece of content:

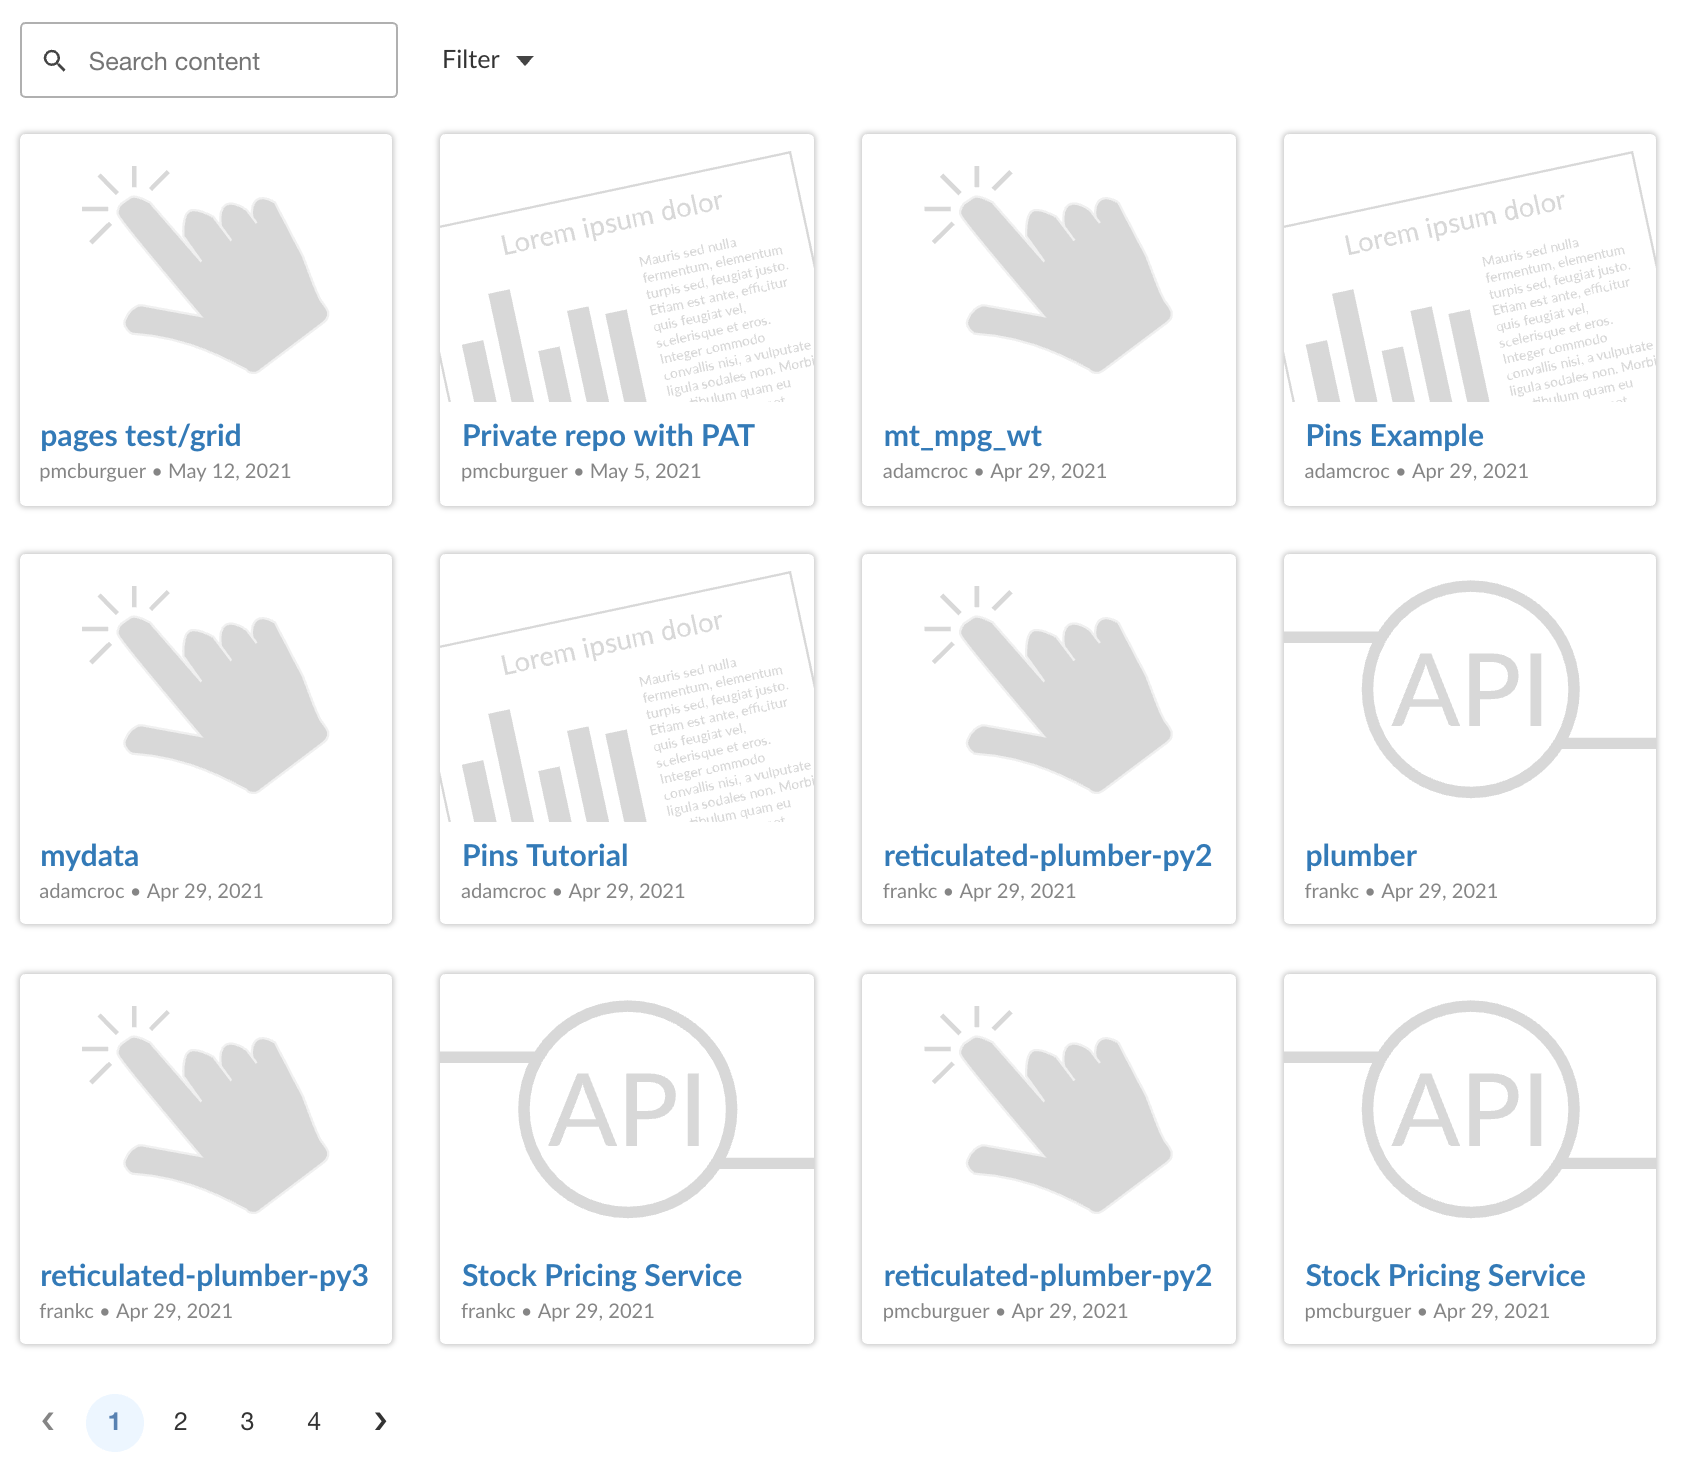
Display multiple content items via a grid:

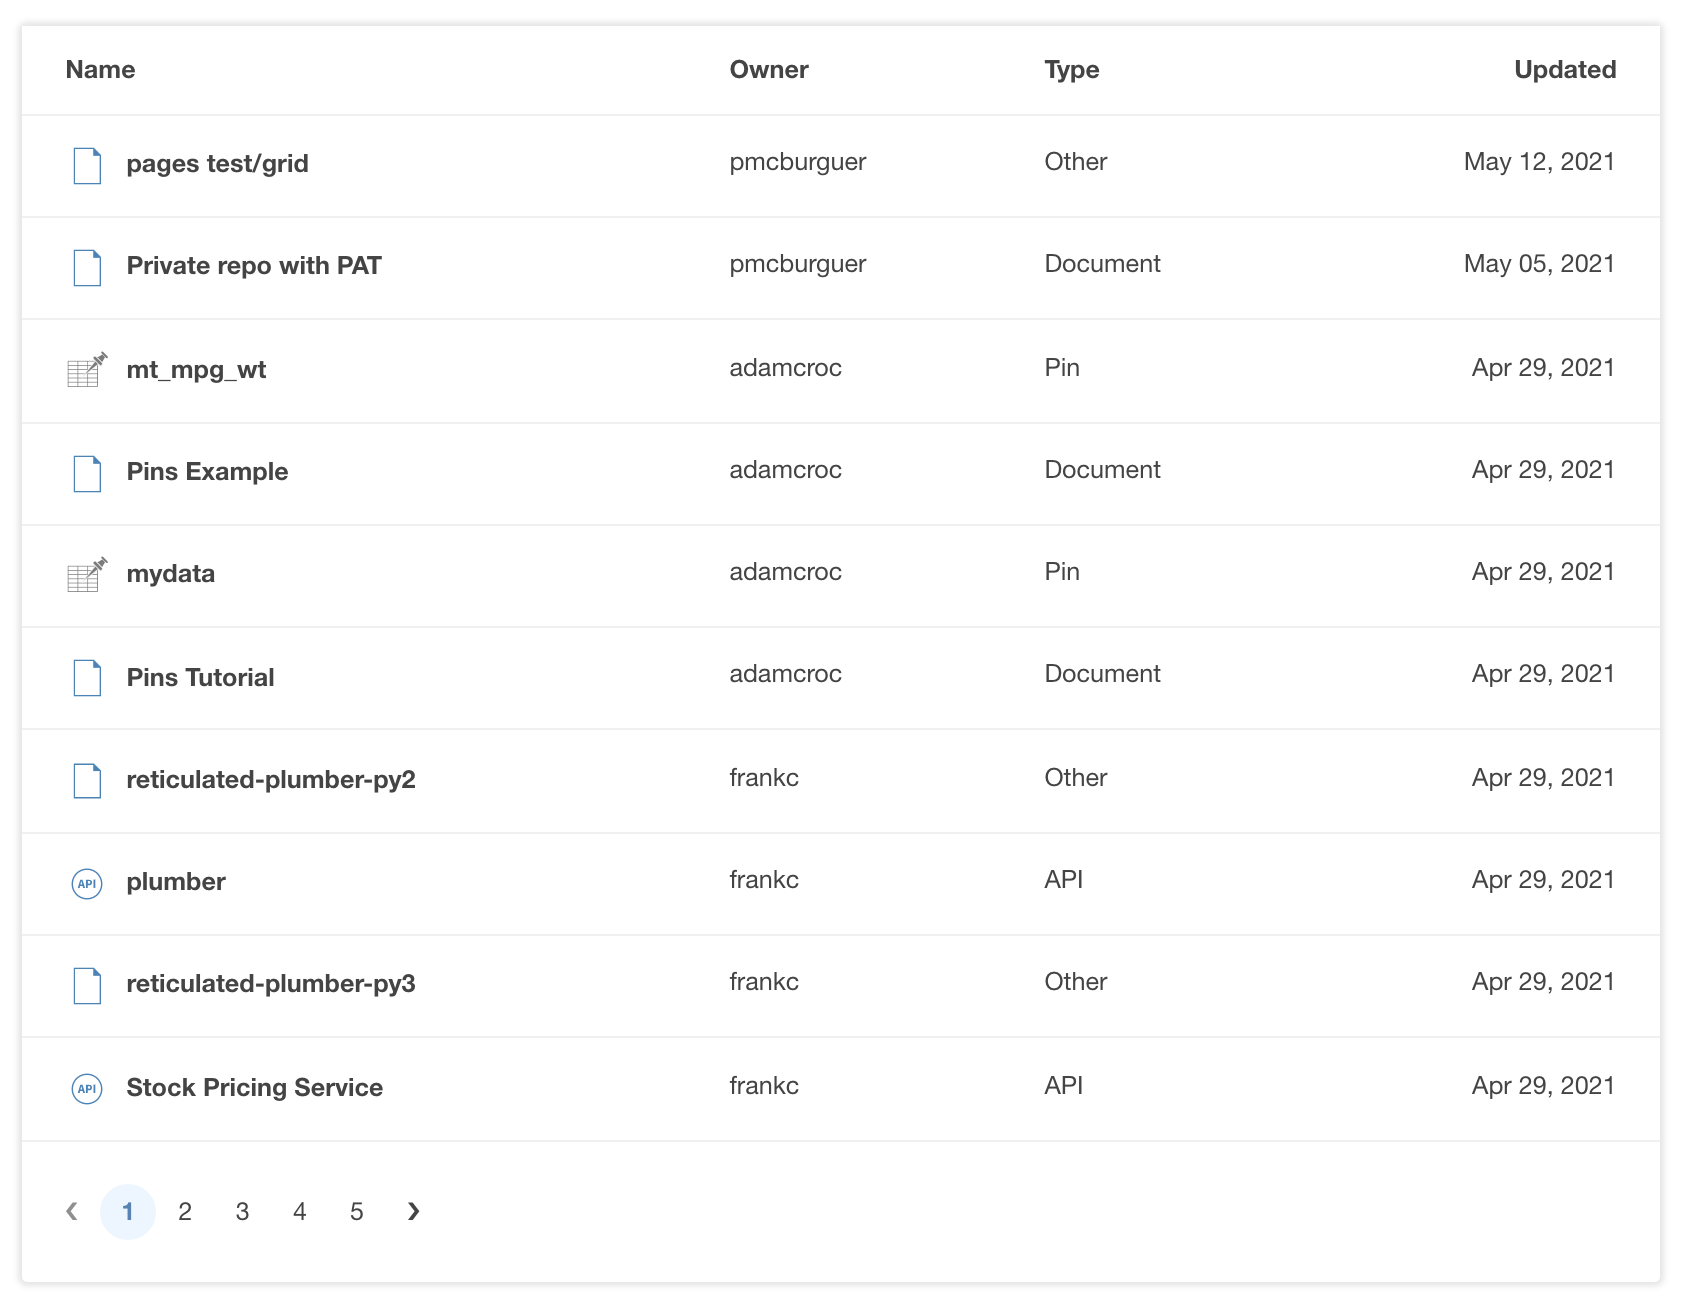
Provide a more detailed view with a table:

The search and filter components help viewers find the content they
are most interested in. You must pass the same content data frame to
rsc_search(), rsc_filter(), and
rsc_table() or rsc_grid() in order for filter
and search to work. You can also create your own
crosstalk::SharedData() object to pass to the components if
you want more control over searching and filtering. Read more at
vignette("using-crosstalk").

connectwidgets components support styling in
rmarkdown::html_document via the bslib package.
You can supply a Bootswatch
theme in the yaml header, e.g.:
---
output:
  html_document:
    theme:
      bootswatch: minty
---
or pass a custom theme consistent with your organization’s style:
---
output:
  html_document:
    theme:
      bg: "#FFF"
      fg: "#22333B"
      primary: "#4F772D"
      dark: "#252525"
      light: "#DCE6D3"
      base_font: "Lato, sans-serif"
      heading_font: "Lato, sans-serif"
      border-color: "#E9F5DB"
      gray-100: "#F7FCF0"
---
Once you’re happy with the look of your page, Publish it to Posit
Connect. Read more at vignette("publishing").
Putting it all together, the example API portal page below:
description text for a couple of
cardsIf no APIs are deployed on your Posit Connect server, try filtering for static documents or Shiny apps instead.
---
output:
  html_document:
    theme:
      bootswatch: lumen
---

```{css, echo=FALSE}
.main-container {
    width: 100%;
    max-width: unset;
}

.main {
    max-width: 940px;
    margin-left: auto;
    margin-right: auto;
}

/* https://codepen.io/eversionsystems/pen/YOmqdj */
.jumbotron {
  color: white;
  background-image: url("https://source.unsplash.com/d30sszrW7Vw/1920x1080");
  background-position: center;
  background-repeat: no-repeat;
  background-size: cover;
  height: 50vh;
}
```

```{r, include=FALSE}
library(connectwidgets)
library(dplyr)
library(htmltools)

knitr::opts_chunk$set(
  comment = "",
  echo = FALSE, warning = FALSE, message = FALSE
)

rsc_content <-
  connect() %>%
  content()

apis <- rsc_content %>%
  filter(app_mode %in% c("api", "python-api"))
```

```{r}
div(
  class = "jumbotron jumbotron-fluid",
  div(
    class = "container",
    h1("Connect API Portal", class = "display-4"),
    p("Model APIs maintained by the data science team")
  )
)
```

```{r}
div(
  class = "main",
  h3("Featured APIs", class = "text-center"),
  {
    model_copy <- c(
      "Our most important model: Distillery retro taiyaki fashion axe.
      Art party cray intelligentsia flexitarian.",
      "Our second most important model: Pug af twee portland pitchfork brunch
      kogi gochujang organic migas shaman four dollar toast 90's slow-carb."
      )

    apis %>%
      slice_head(n = 2) %>%
      mutate(
      description = model_copy
      ) %>%
      rsc_card()
  },
  h3("All APIs", class = "text-center"),
  p("that thing George Box said one time. You know what thing."),
  {
    tagList(
      rsc_cols(rsc_search(apis), rsc_filter(apis)),
      rsc_grid(apis)
    )
  }
)
```