![]()
The R package gratis (previously known as
tsgeneration) provides efficient algorithms for generating
time series with diverse and controllable characteristics.
install.packages("gratis")You can install the development version of
gratis package from GitHub Repository with:
devtools::install_github("ykang/gratis")Watch this YouTube video provided by Prof. Rob Hyndman.
library(gratis)
library(feasts)set.seed(27)
mar_model(seasonal_periods=12) %>%
generate(length=120, nseries=2) %>%
autoplot(value)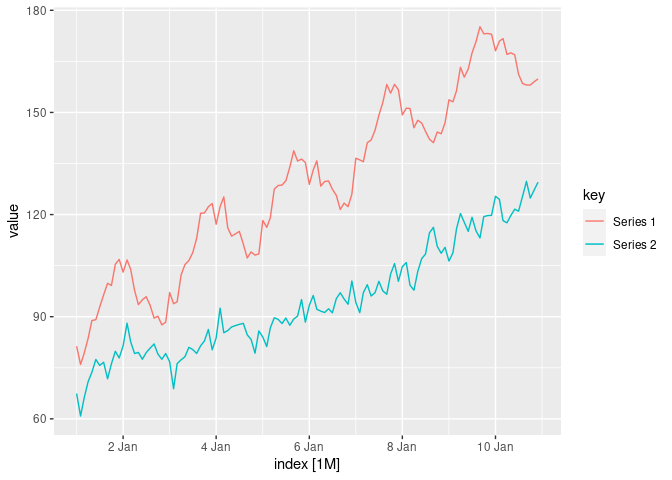
mar_model(seasonal_periods=c(24, 24*7)) %>%
  generate(length=24*7*10, nseries=12) %>%
  autoplot(value)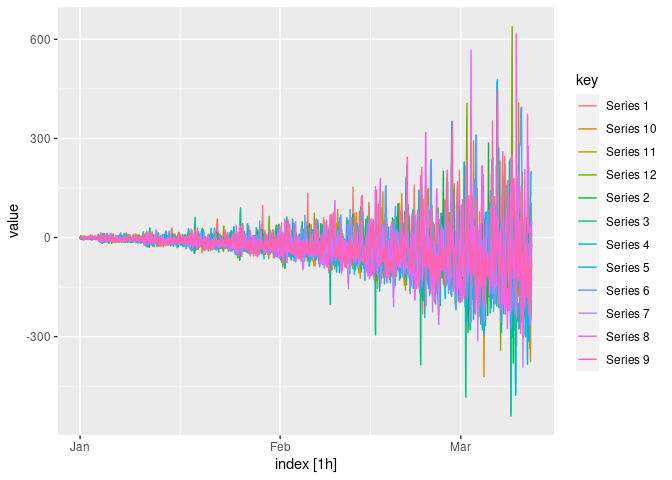
library(dplyr)
# Function to return spectral entropy, and ACF at lags 1 and 2
# given a numeric vector input
my_features <- function(y) {
  c(tsfeatures::entropy(y), acf = acf(y, plot = FALSE)$acf[2:3, 1, 1])
}
# Produce series with entropy = 0.5, ACF1 = 0.9 and ACF2 = 0.8
df <- generate_target(
  length = 60, feature_function = my_features, target = c(0.5, 0.9, 0.8)
)
df %>%
 as_tibble() %>%
 group_by(key) %>%
 reframe(value = my_features(value),
           feature=c("entropy","acf1", "acf2")
           )
#> # A tibble: 30 × 3
#>    key       value feature
#>    <chr>     <dbl> <chr>
#>  1 Series 1  0.509 entropy
#>  2 Series 1  0.906 acf1
#>  3 Series 1  0.787 acf2
#>  4 Series 10 0.465 entropy
#>  5 Series 10 0.896 acf1
#>  6 Series 10 0.775 acf2
#>  7 Series 2  0.483 entropy
#>  8 Series 2  0.901 acf1
#>  9 Series 2  0.812 acf2
#> 10 Series 3  0.504 entropy
#> # ℹ 20 more rows
autoplot(df)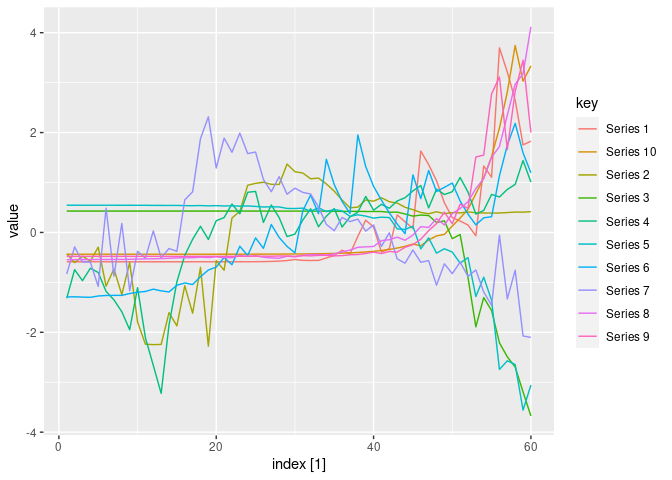
You can also run the time series generation procedure in a shiny app
app_gratis()Or visit our online Shiny APP
tsfeatures from GitHub
Repository.This package is free and open source software, licensed under GPL-3.
Feng Li and Yanfei Kang are supported by the National Natural Science Foundation of China (No. 11501587 and No. 11701022 respectively). Rob J Hyndman is supported by the Australian Centre of Excellence in Mathematical and Statistical Frontiers.