![]()
plotor makes it easy to generate clear, publication-ready odds-ratio plots and tables from logistic regression models.
If you work with binary outcomes, plotor helps you go from model → interpretation in seconds.
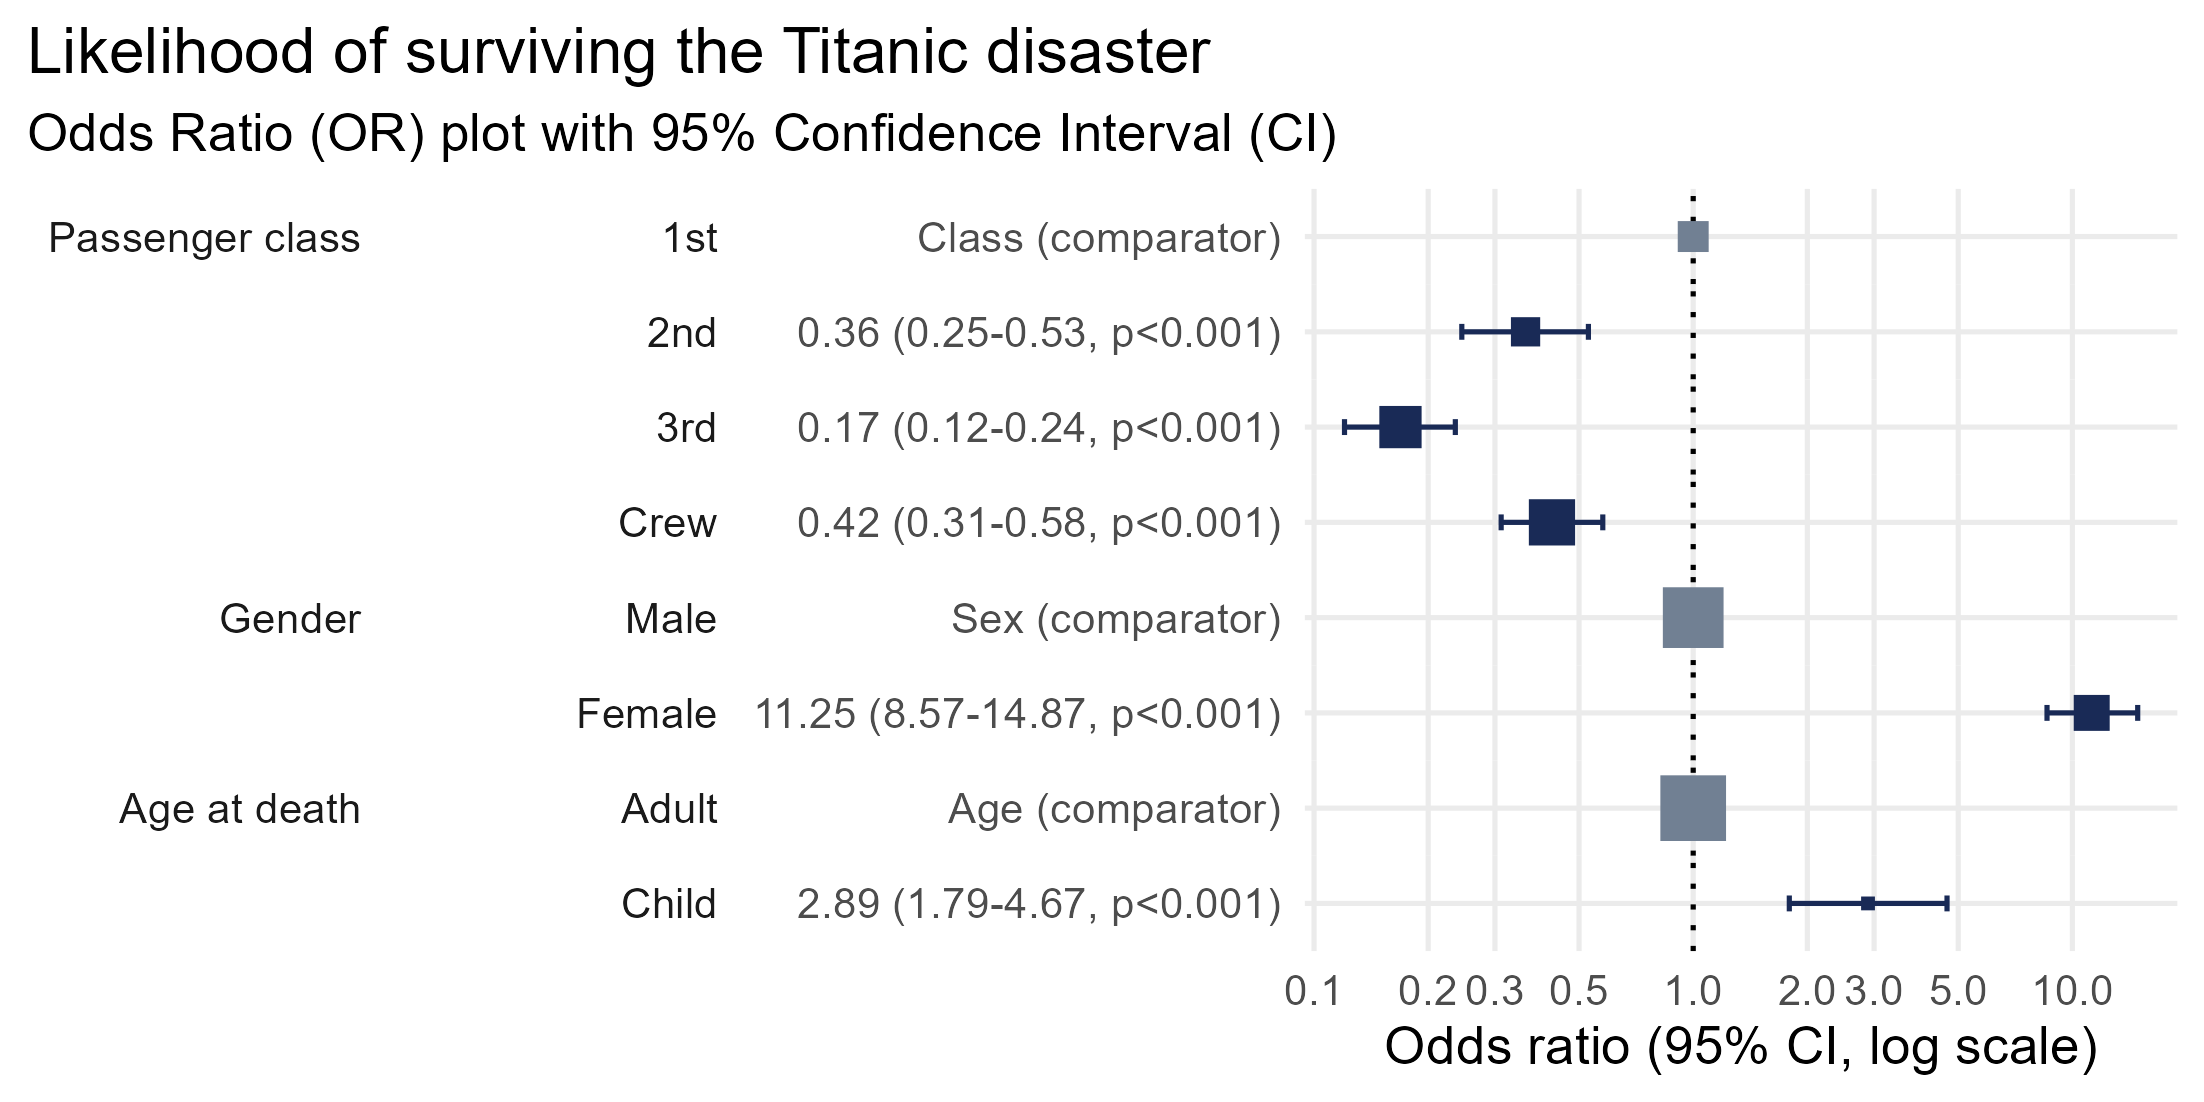
A single function call gives you a polished OR plot:
Perfect for reports and publications:
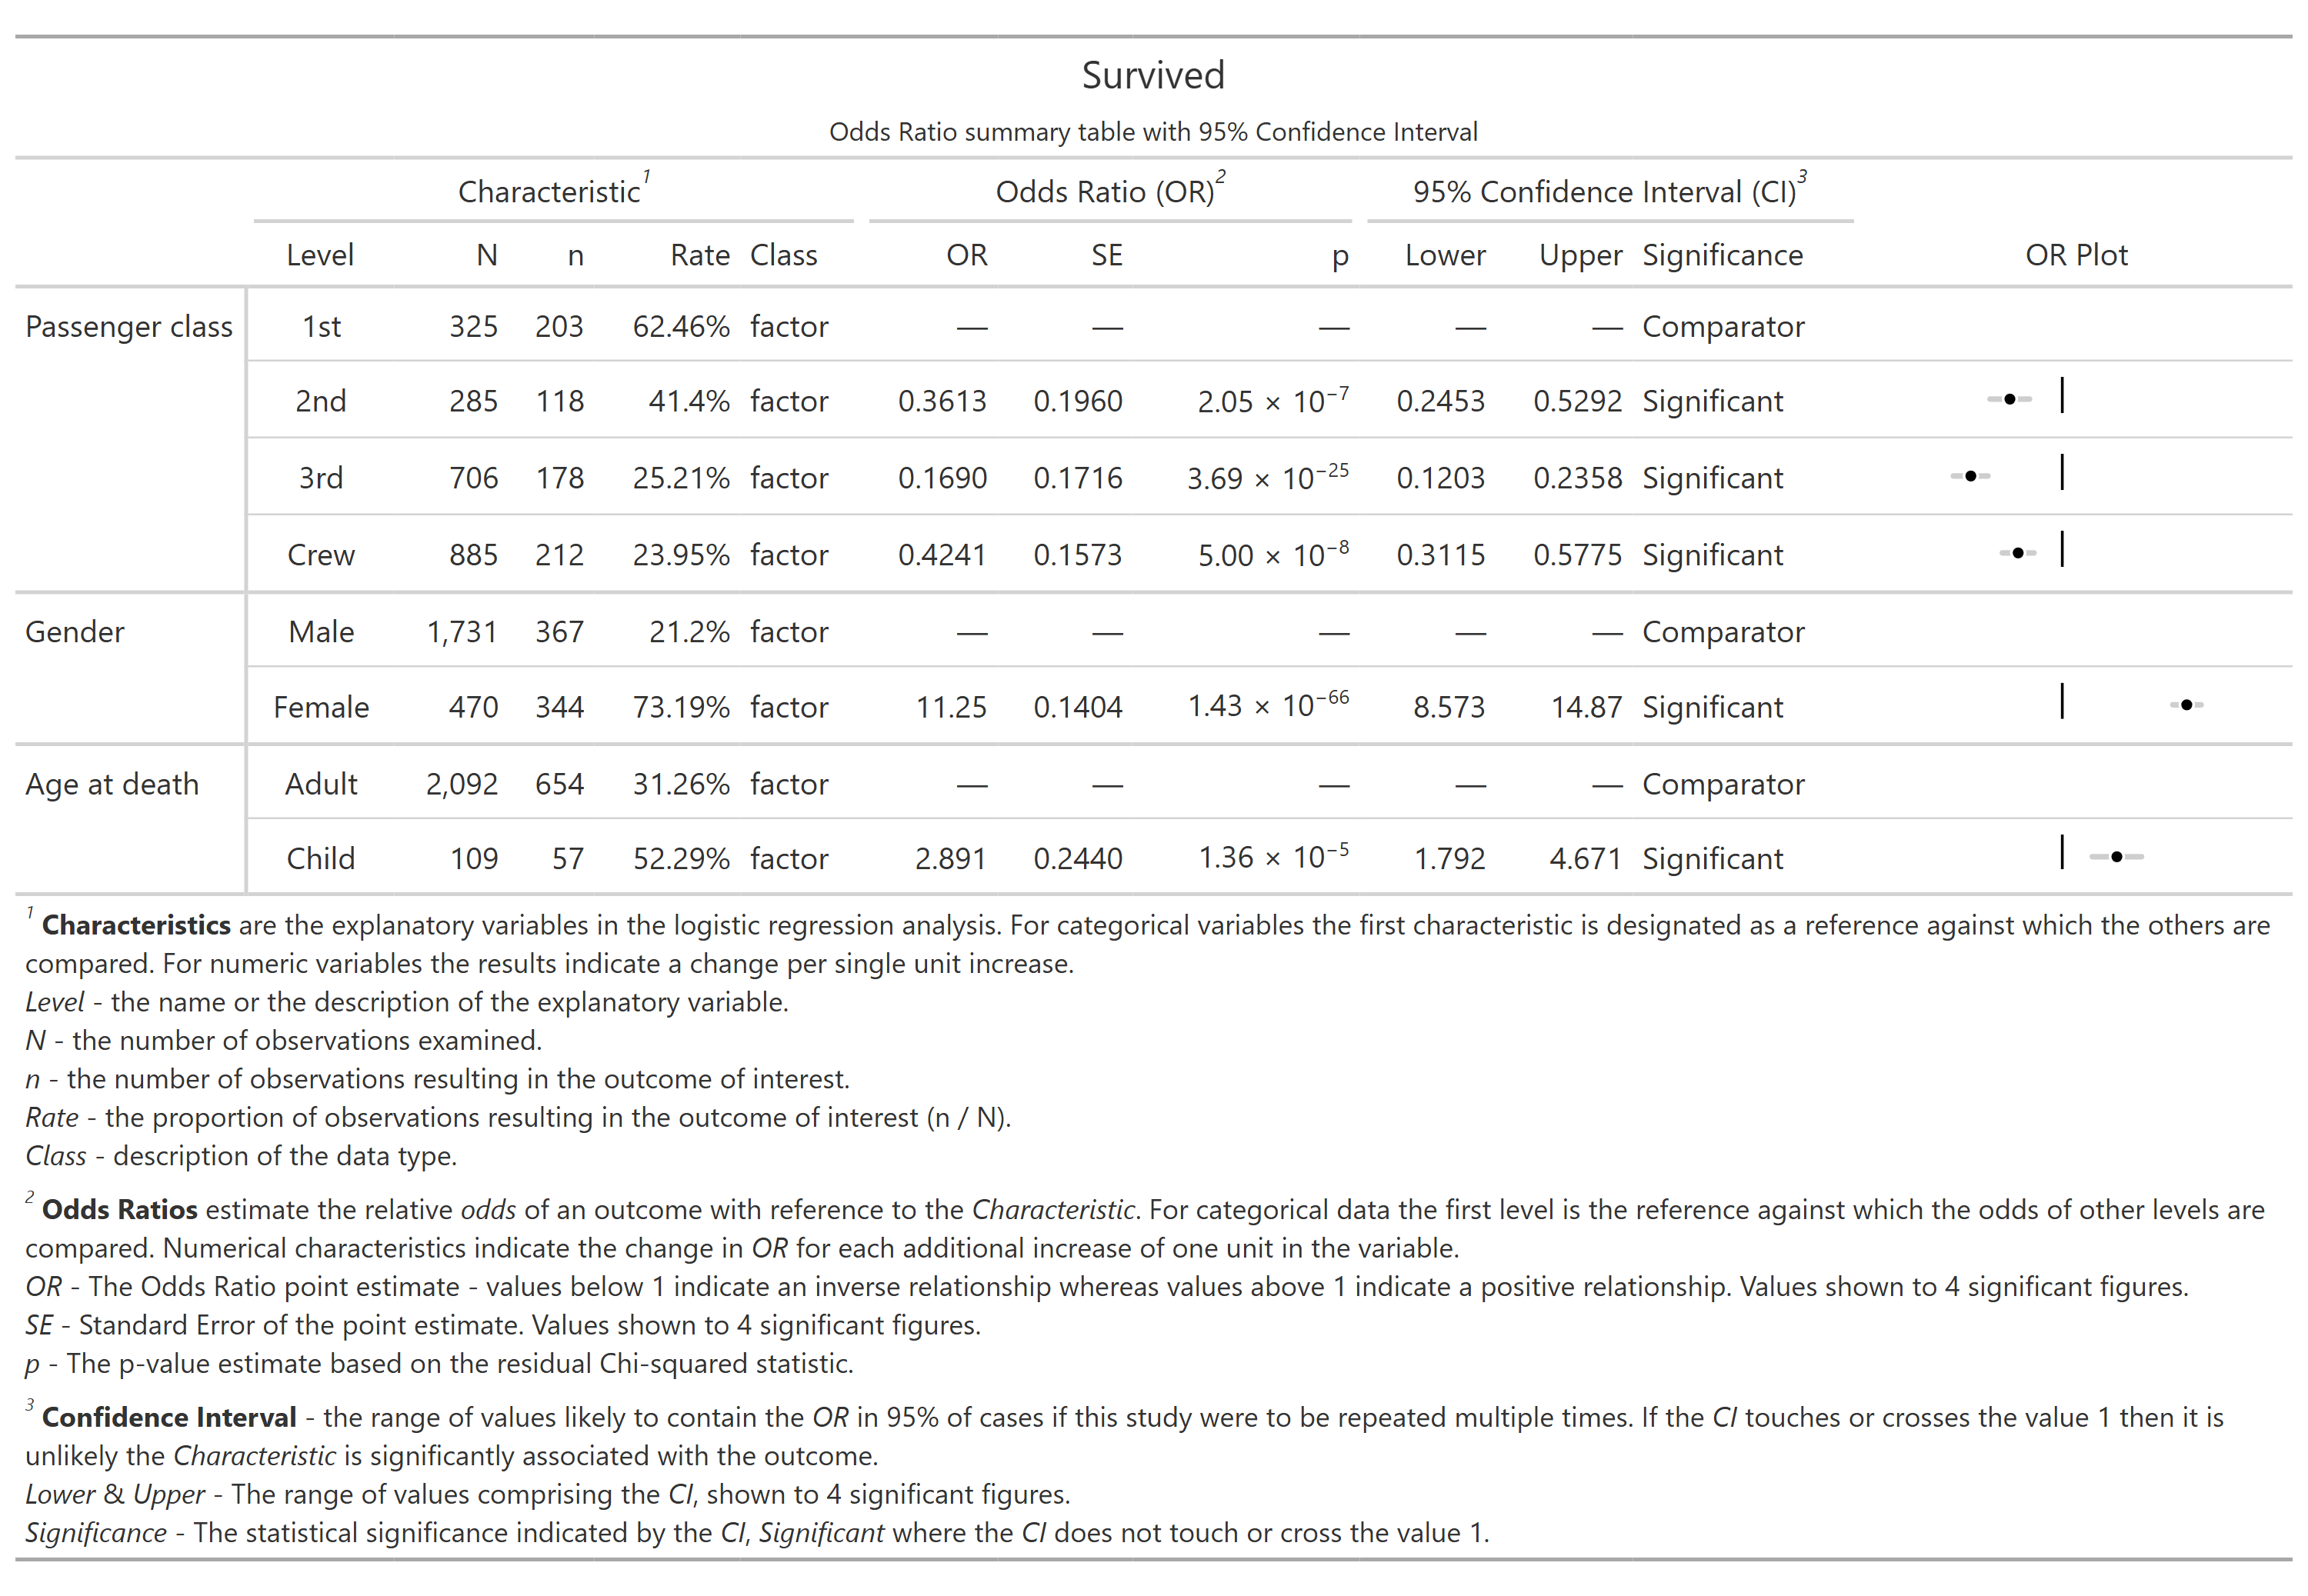
See full table output options →
plotor includes built-in checks to help validate your logistic regression model:
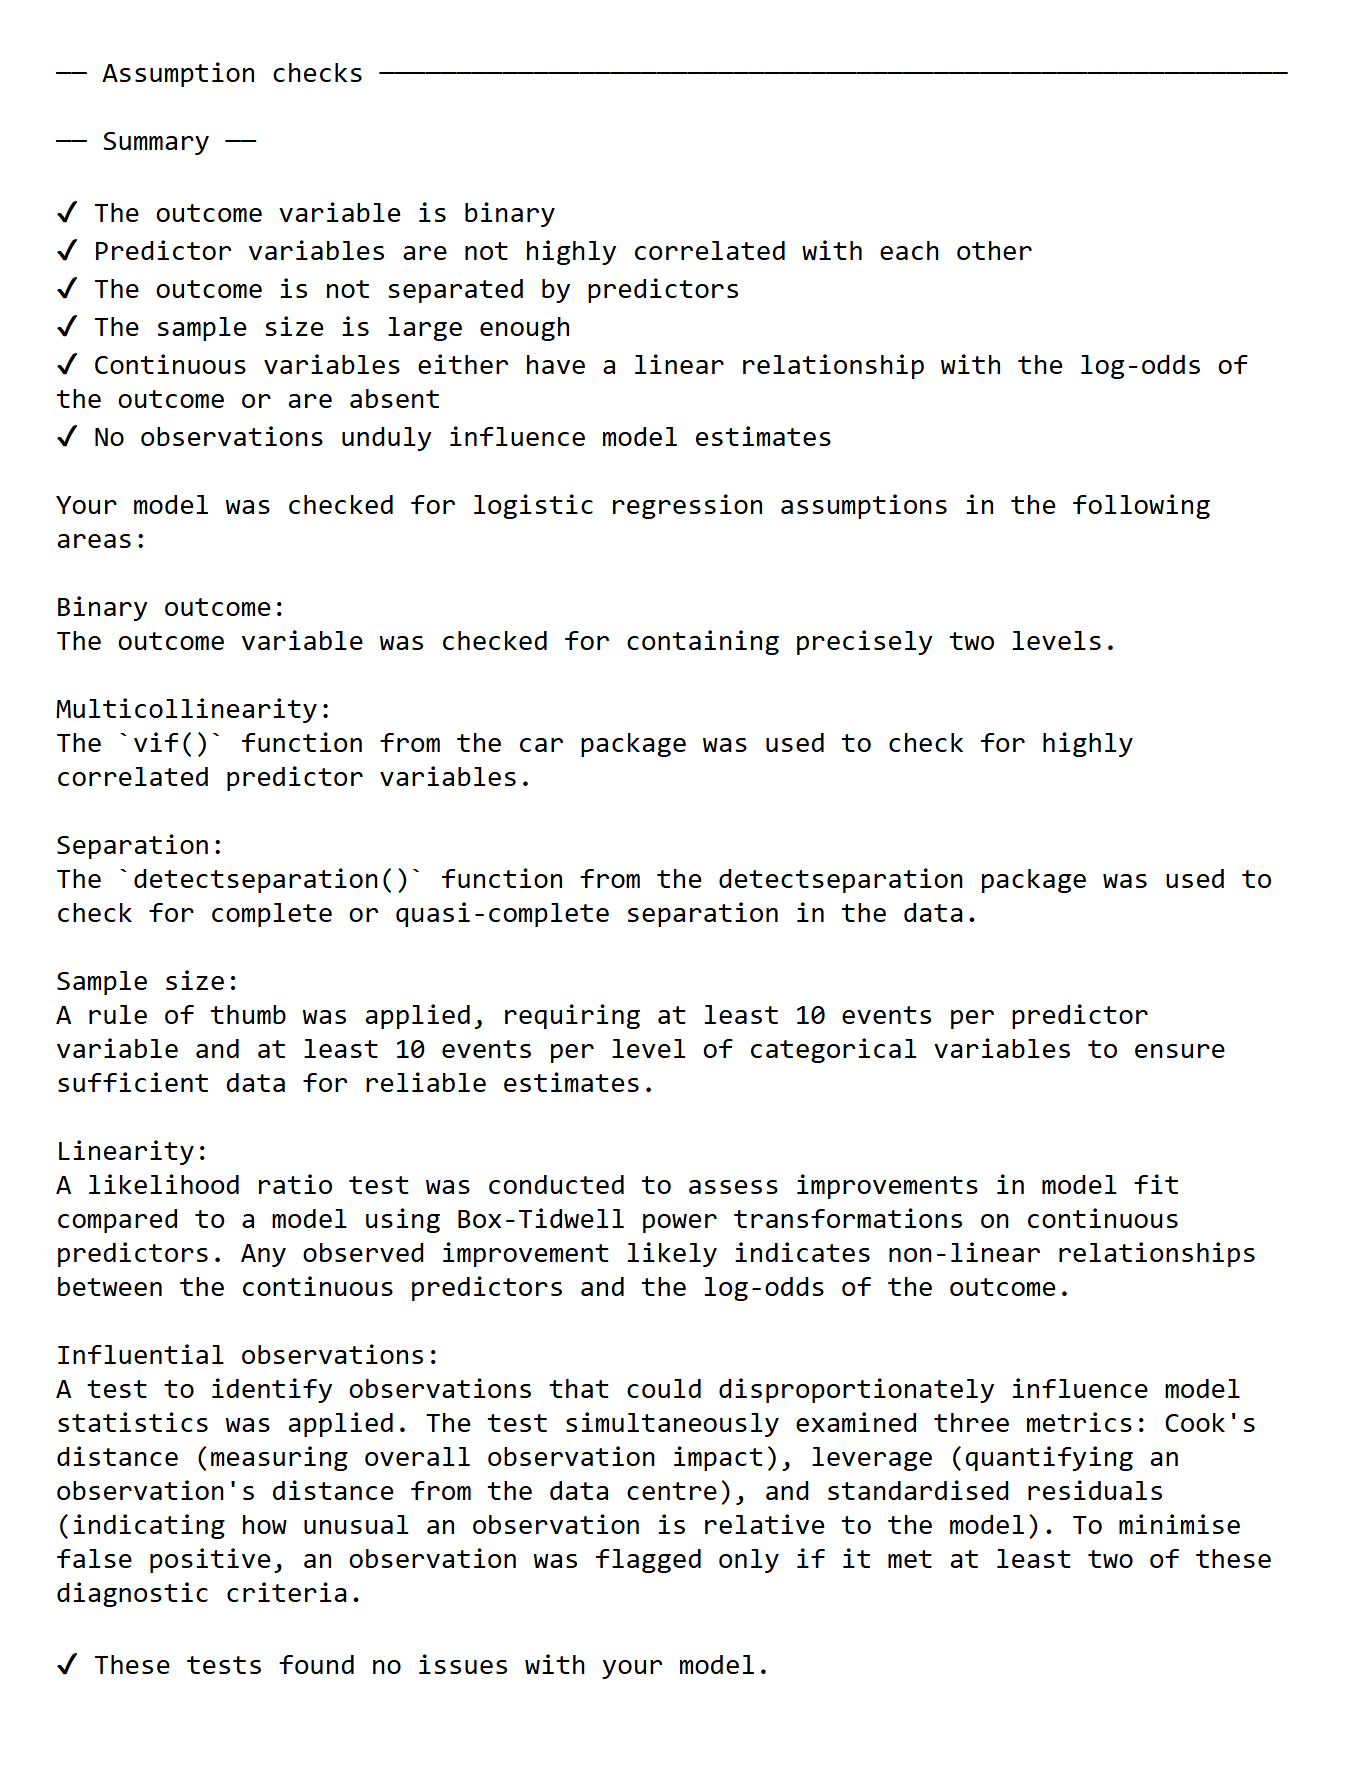
See full assumption check output →
Stable release (CRAN):
install.packages("plotor")Using {pak}:
# install.packages("pak")
pak::pak("plotor")
Development version:
# install.packages("pak")
pak::pak("craig-parylo/plotor")library(plotor)
# load the titanic dataset from the package
df_titanic <- get_df_titanic()
# make a logistic regression model using this data
model <- stats::glm(
data = df_titanic,
formula = Survived ~ Class + Sex + Age,
family = "binomial"
)
# plot the odds ratios
plot_or(model)?plot_or?table_or?check_orFull documentation: https://craig-parylo.github.io/plotor/